It’s time to move on from PowerPoint presentations and Excel sheets. A data visualization tool is here to make presentations more attractive, fun, engaging, and compelling.
Whether you are a consultant, marketer, part of a sales team, or business owner, data visualization can help you share a vast amount of information in a simple and effective format. You don’t need to rely on an IT team or designer to create premium, interactive data visualization applications.
Juice Analytics presents Juicebox to develop data visualization apps for your organization.

What is a Juicebox?
Founded in 2005, Juicebox is a platform that lets you build data visualization apps without writing any code. You can use the platform to present data in an attractive, engaging way. No matter how complex the data is, you can use different methods to make it appealing and easy to understand.
Login to your account, go to the Editor Panel, and start creating the app. Pick a template that will be the best choice for your data. Start editing by changing the color scheme. Add data to the Story Designer by uploading a CSV file.
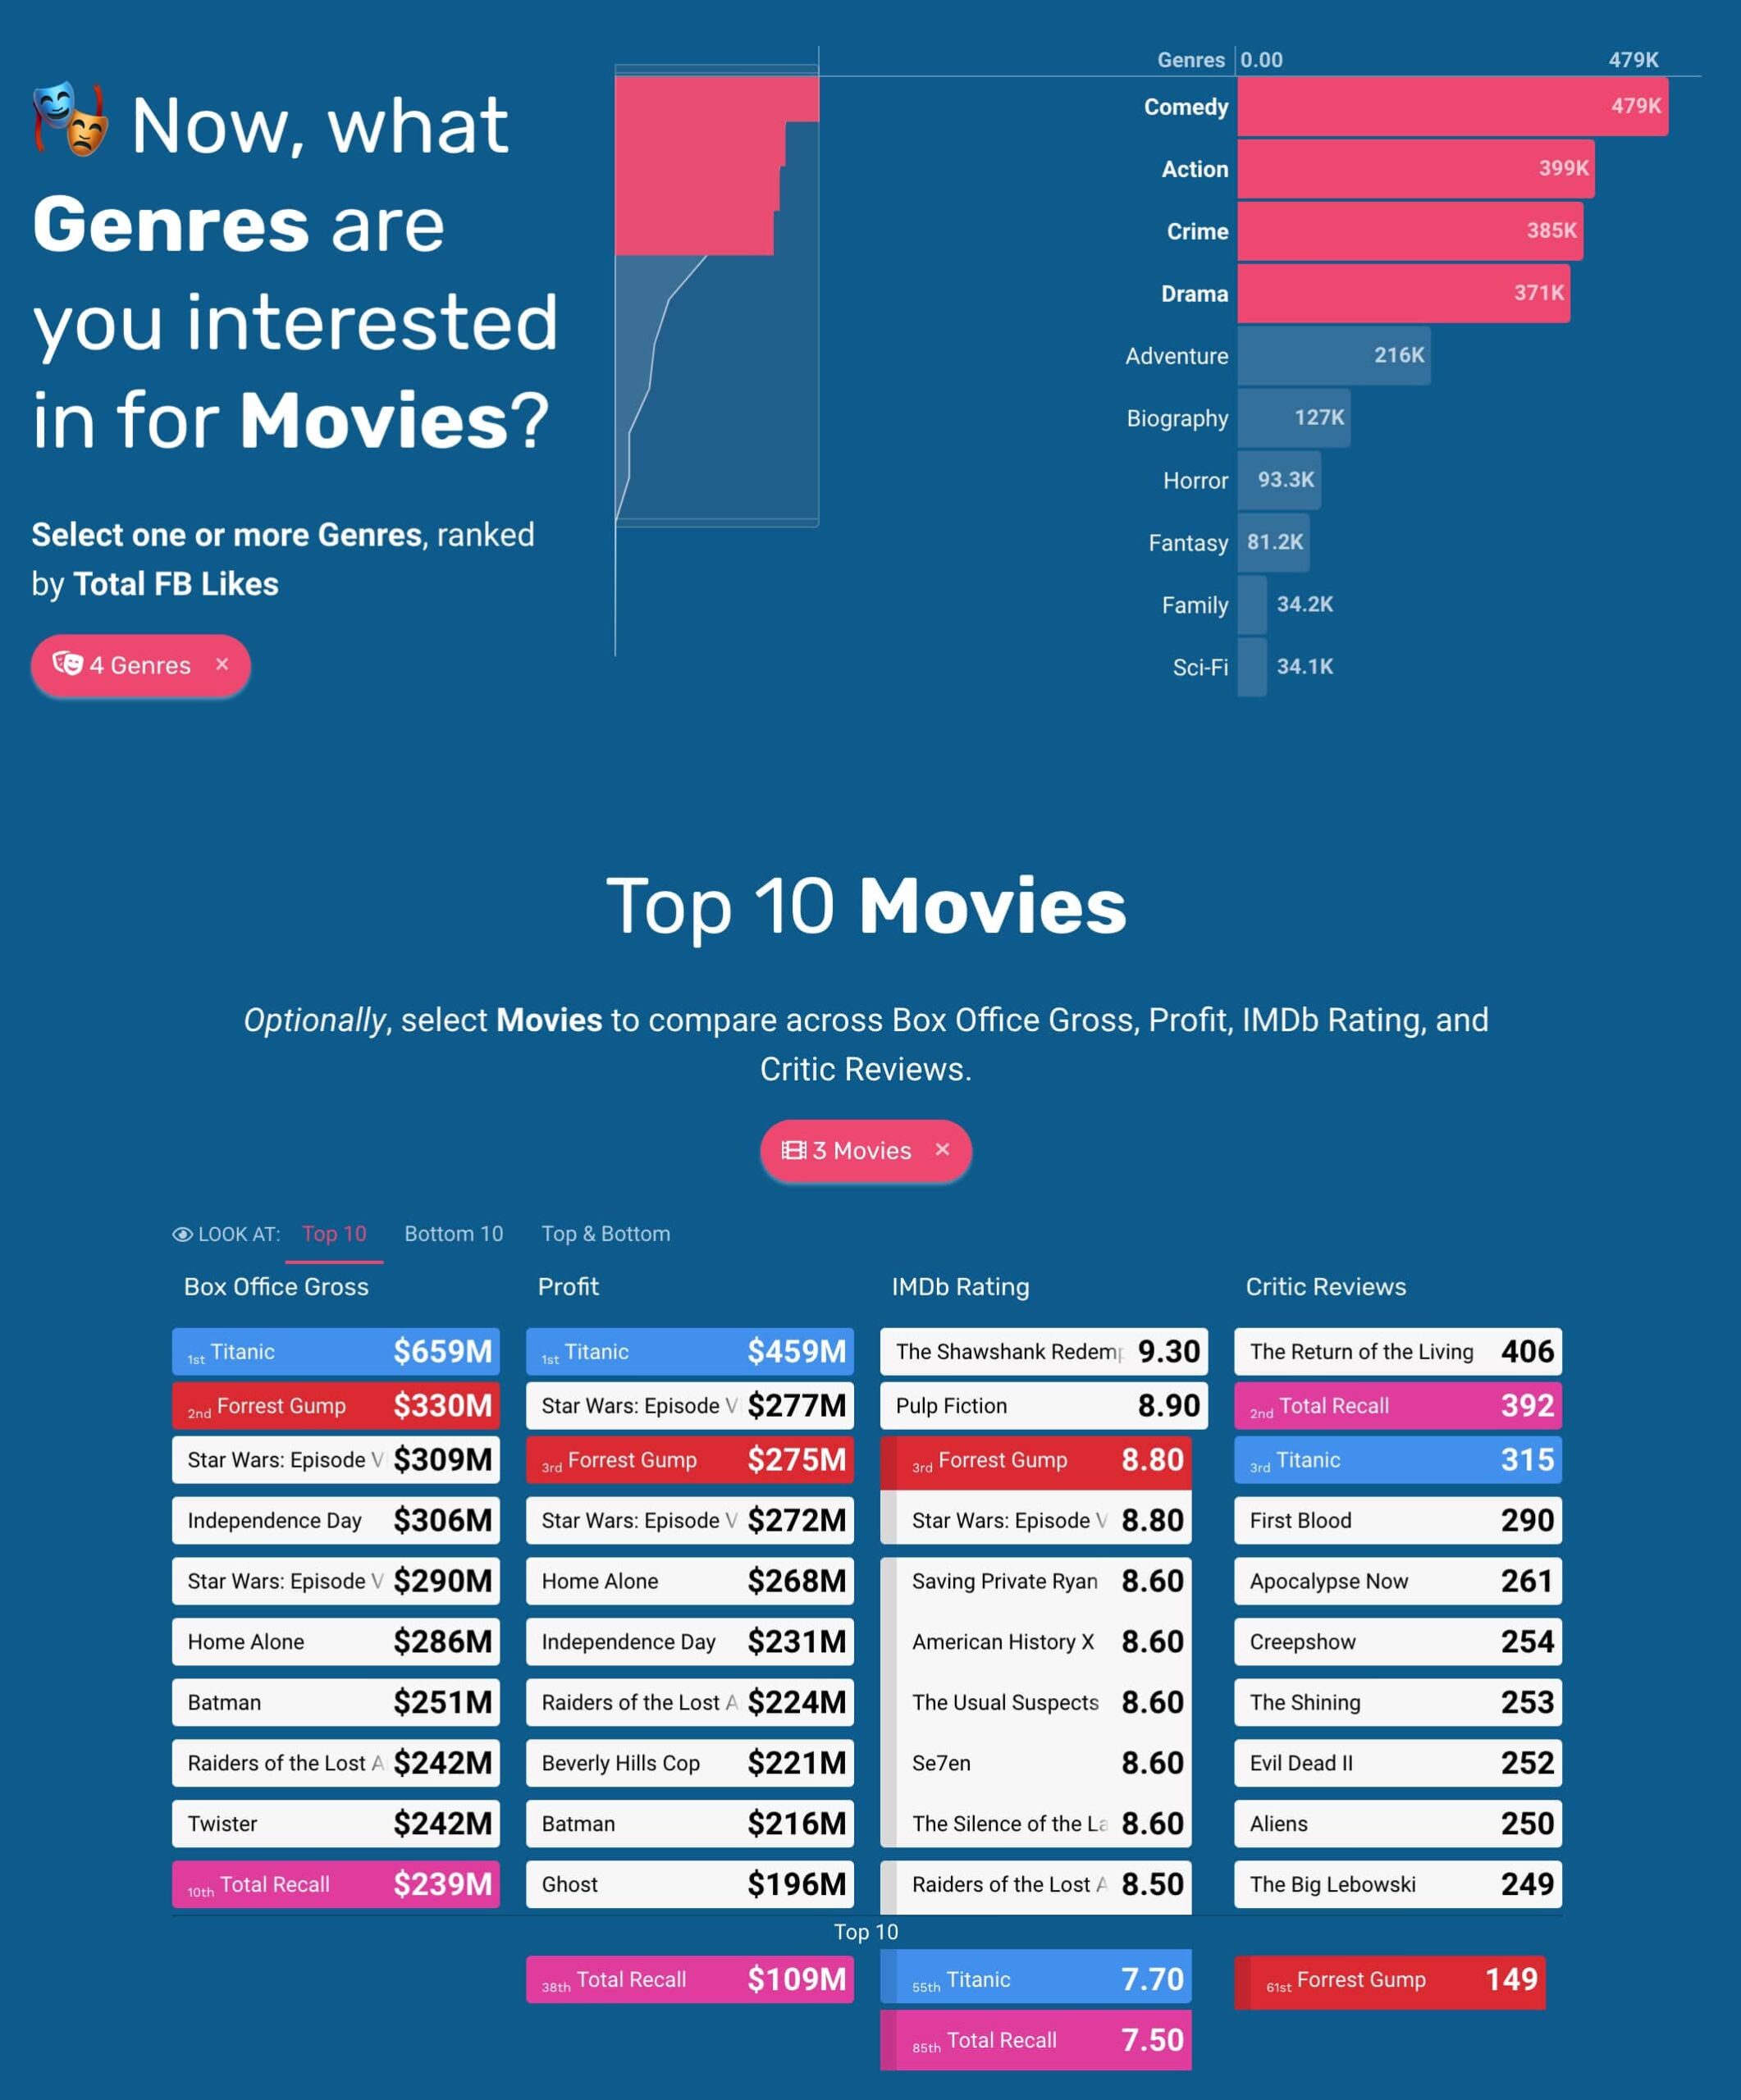
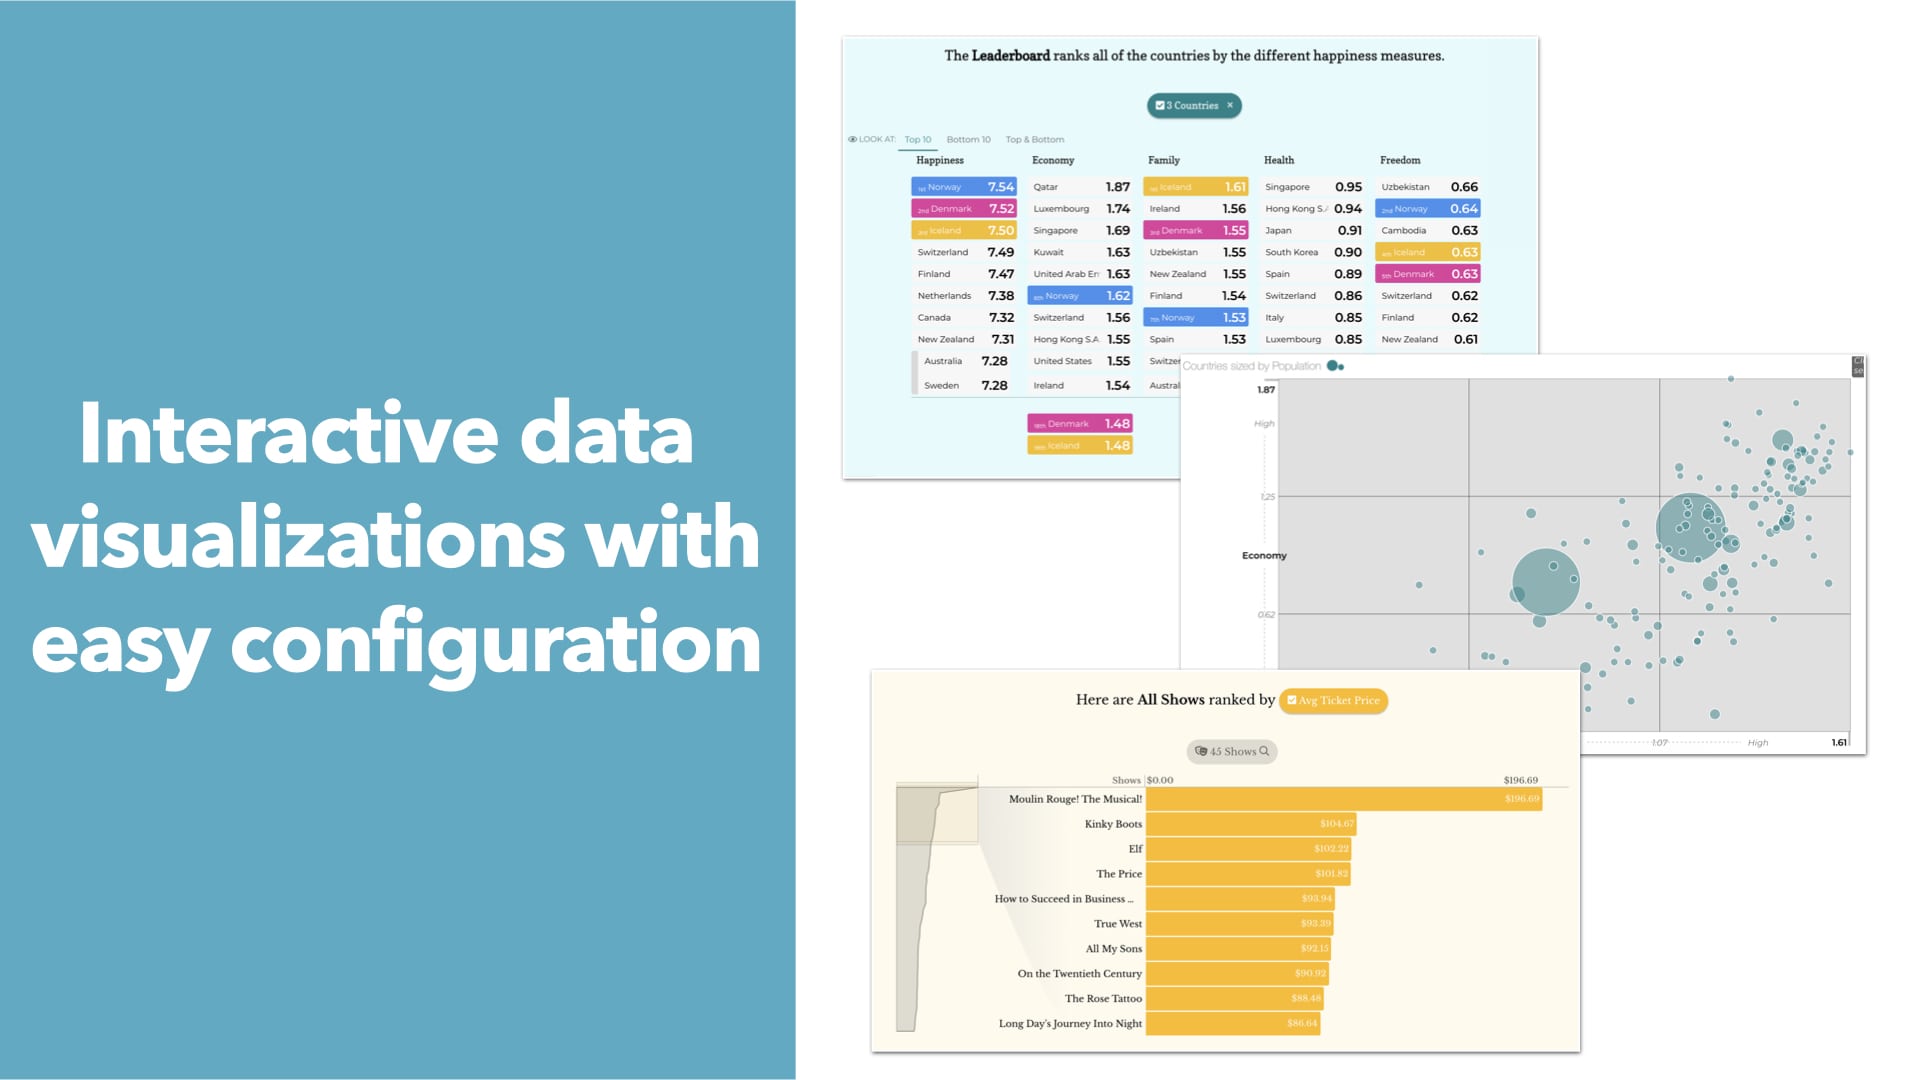
The Story Designer will work its magic to present the data in graphs, charts, lists, and other interactive ways. Once done, share the URL with users, and they can see the latest presentation every time. Users can click on the elements to get insights about a specific aspect and get more information.
You can create as many apps as you want for every dataset.
Parts of Juicebox App
A Juicebox app has three major parts-
→ Story: Also known as data story, it is a set of connected data visualization charts combined into a single webpage. In contrast with a traditional dashboard, which tries to fit all the data into a single view, Juicebox data stories provide a guided path through the data, giving room for explanation and exploration of the data.
→ Section: A story is made of several sections. You can change and customize the colors and layout of each section to make the app more appealing.
→ Slice: Every section has multiple slices. A slice is an actual part where your data is presented. It can include a visualization, an image, and a block of text.
Juicebox makes it easy to develop a data visualization app by applying the selections for slices to all of them. You can streamline the data flow and steer the story the way you want it to be presented.
Why use Juicebox?
1. Sales Pitches
The sales team works hard to attract more leads and convert them to customers of the business. The aim is to shorten the sales cycle and capture more leads in less time to increase the return on investment. Instead of giving lengthy and boring Powerpoint presentations, use the data visualization tool by Juicebox.
2. Sales Pipeline Analysis
If capturing leads is one aspect, sharing the updates with the management is another. The teams have to regularly analyze if their strategies are bearing results or not. The sales team can create presentations that are informative and attractive. If you want to convince the management to increase the budget, this is the way to do it.
3. Marketing Campaign
Marketing reports can be really boring when you look at them every week. And if you own a marketing agency, it’s a daily task. Enough of PPTs and Excel sheets with neverending details. Move on to the Juicebox platform and combine the elements the way you want. Turn marketing reports into colorful presentations that you and your clients will love.
4. Interactive Infographics
An infographic presents huge amounts of data on a single page. Text, images, and graphical representations are used to compress data and share it with the viewers. Users can get more details by clicking on the visualizations.
5. Client Presentations
As we mentioned above, the Juicebox app can be used to create data visualizations to make client meetings more fun and engaging. You’ll notice that it’s easier to answer the client’s questions with just a click.
Juice Analytics Pricing
Juice Analytics has three price plans to choose from:-
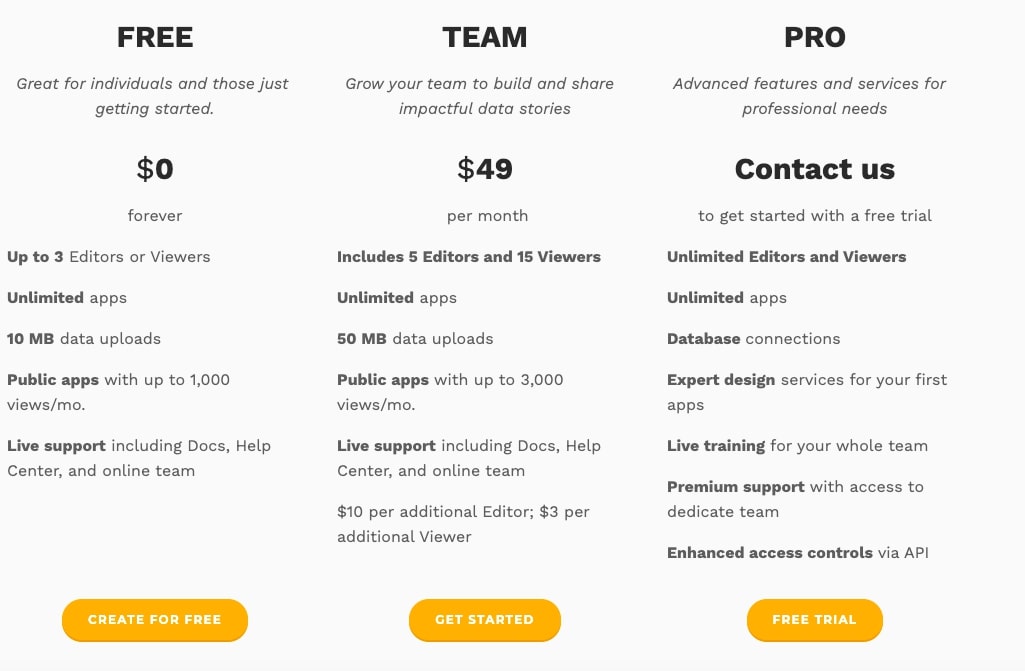
1.FREE PLAN (For Individuals)
Up to 3 Editors or Viewers, Unlimited apps, 10 MB data uploads, Public apps with up to 1,000 views/mo, Live support including Docs, Help Center, and online team
2.TEAM PLAN – $49/month (For Smaller Teams)
Includes 5 Editors and 15 Viewers, Unlimited apps, 50 MB data uploads, Public apps with up to 3,000 views/mo, Live support including Docs, Help Center, and online team, $10 per additional Editor; $3 per additional Viewer
3.PRO PLAN – Customized based on client’s needs (for Enterprises)
Unlimited Editors and Viewers, Unlimited apps, Database connections, Expert design services for your first apps, Live training for your whole team, Premium support with access to dedicate team, Enhanced access controls via API
The company offers premium, dedicated support with the Pro plan and also provides access to the API.
Final Conclusion
When handling data is an essential part of your job, don’t let it overwhelm you anymore. Let Juicebox convert and present the data in a way that’s easily understood by everyone. You can save time, money, and effort using Juicebox. Create and share the best data stories with the management, other teams, and your clients.
")

")
